What is Big Data?

Machine learning algorithms—What's in the black box?

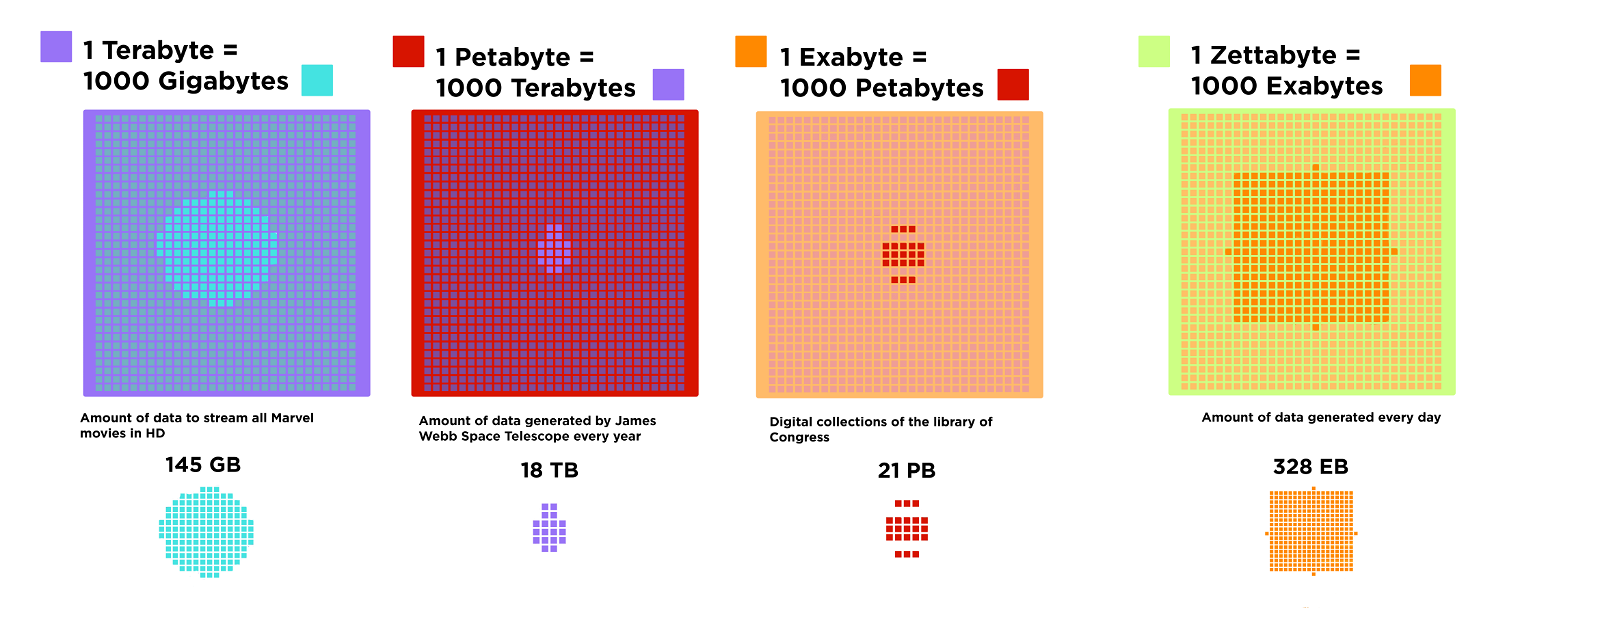
Artificial intelligence and machine learning help us make sense of big data. They can find patterns, analyze data, and predict what might happen next. It can seem like magic: data goes in, and answers come out. But behind those “magic” results are many rounds of training and refining.

Machine learning is how computer algorithms learn to find meaningful information in data. Machine learning algorithms are sets of programmed instructions. These instructions tell the algorithm how to update its procedures depending on the data it encounters.

Machine learning developers train algorithms on an existing dataset. If the algorithm is learning to read x-rays, for example, developers will give it lots and lots of existing x-ray images.

A title at the top states “Supervised Learning” with a subtitle underneath that says “Objective: What makes a bird a bird and not a bat?” A robotic humanoid figure looks at three posters while a person with a green shirt and long blond hair points with a pointer to a poster with “Bat” written above four different illustrations of bats. Another poster has “Bird” written above four illustrations of different birds. The third poster has a question mark written above four illustrations. Three of the four are birds and one is a bat.

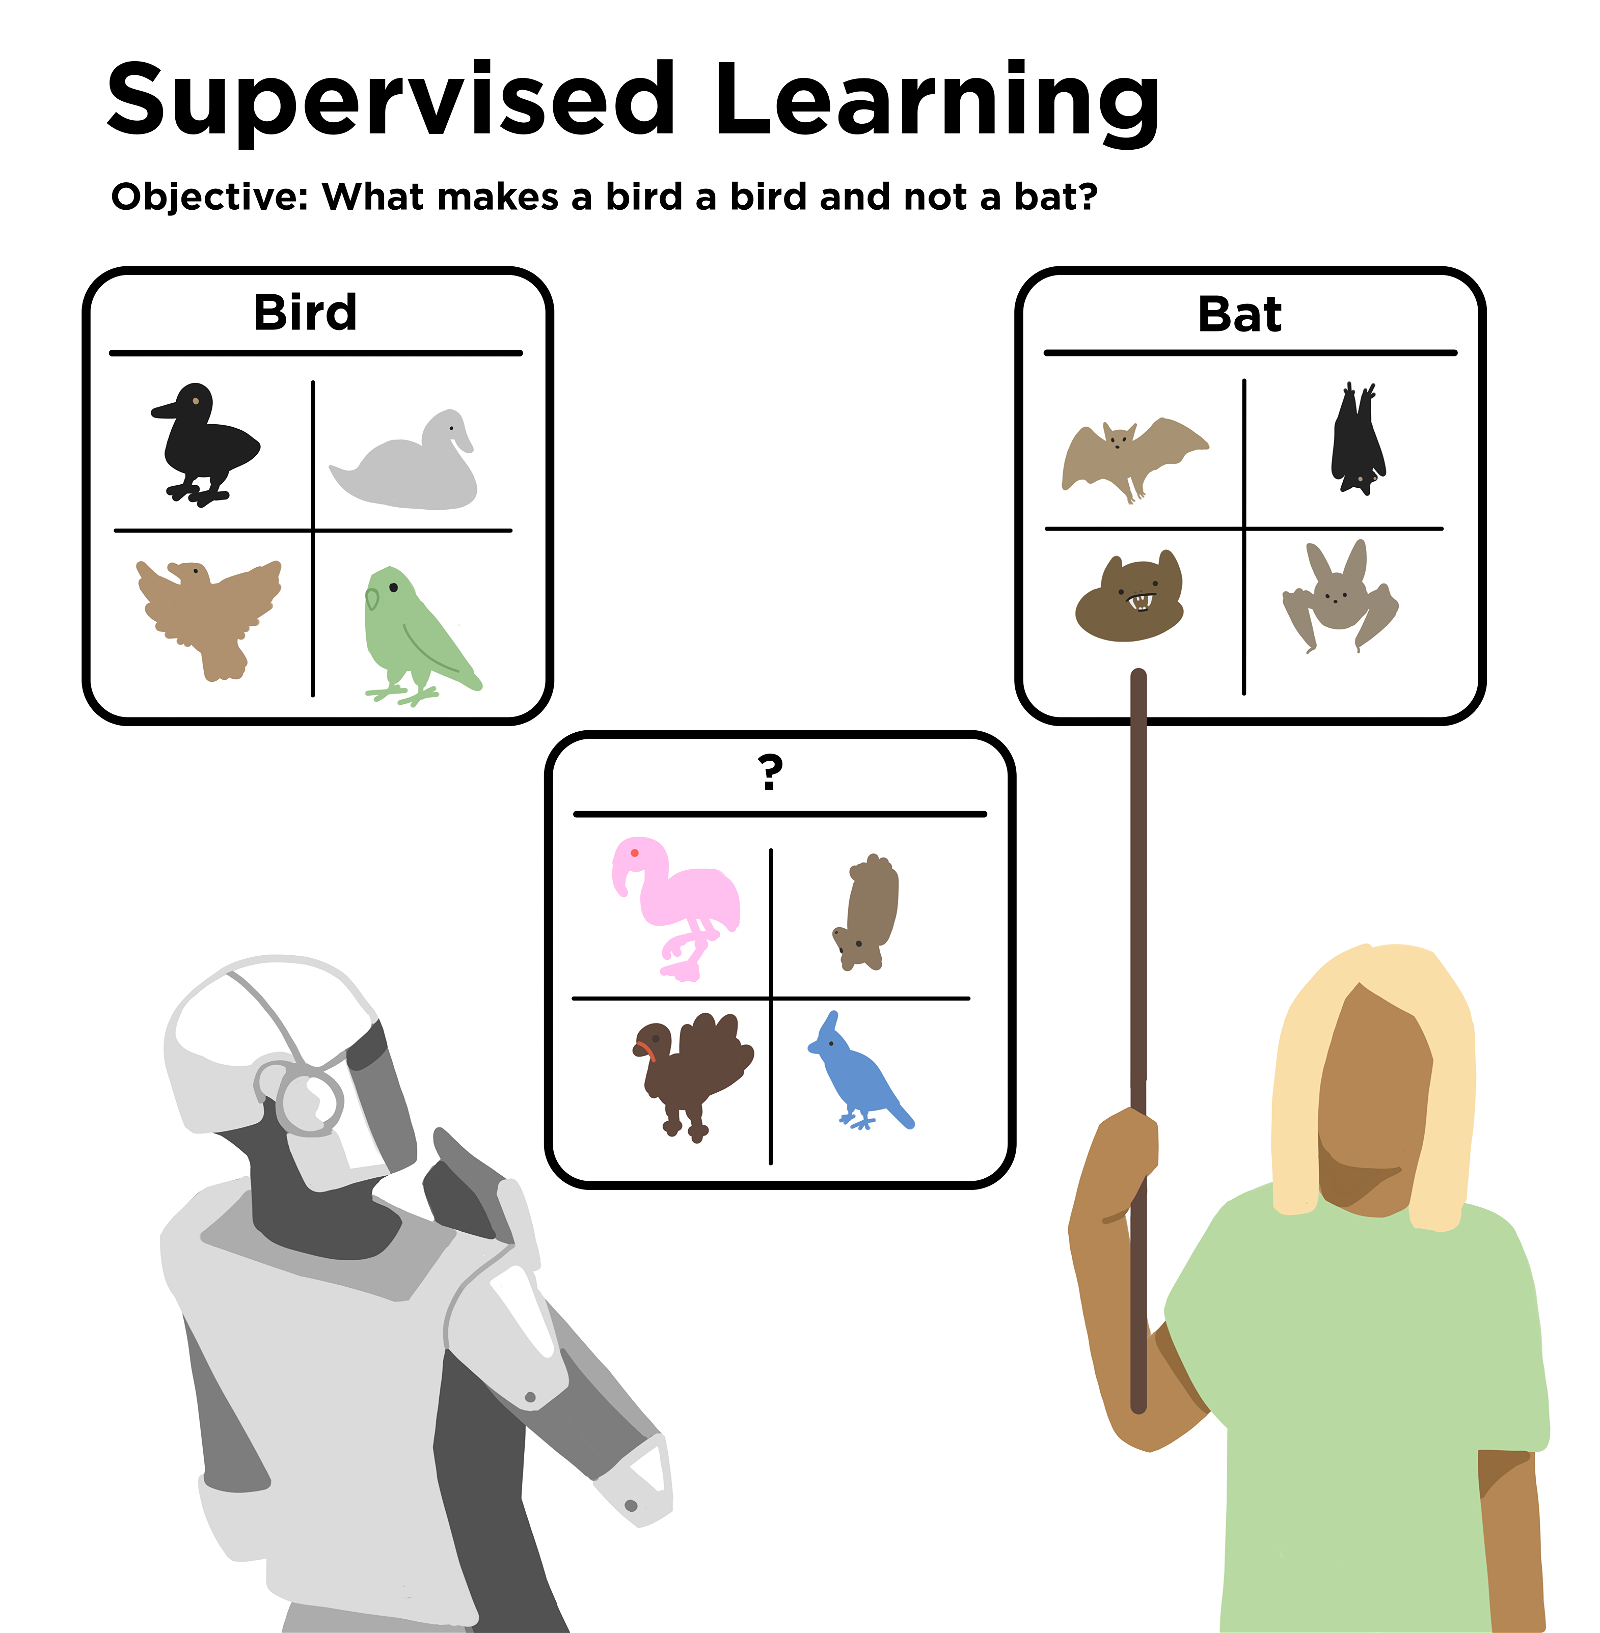
In supervised learning, the developers give the algorithm labels to help it know what to look for. For example: whether or not an x-ray shows a broken wrist. The labels help the algorithm learn the difference. After “training,” the developers would then give the algorithm a new set of unlabeled images. The developers want to see how well it does. This training and validation process continues until the algorithm produces good enough results.

A title at the top states “Unsupervised Learning” with a subtitle underneath that says “Objective: What’s the best way to group these?” A robotic figure stands looking at four posters. On a table in front of the figure are four cards representing a black tall chair, a green stuffed chair, a red ottoman, and a brown three-legged stool. The figure holds a card with a blue chair on it. One poster has “Size” written on it and has a card showing a white banana chair pinned to it. The other posters have written on them “# of Legs,” “Weight,” and “Color.”

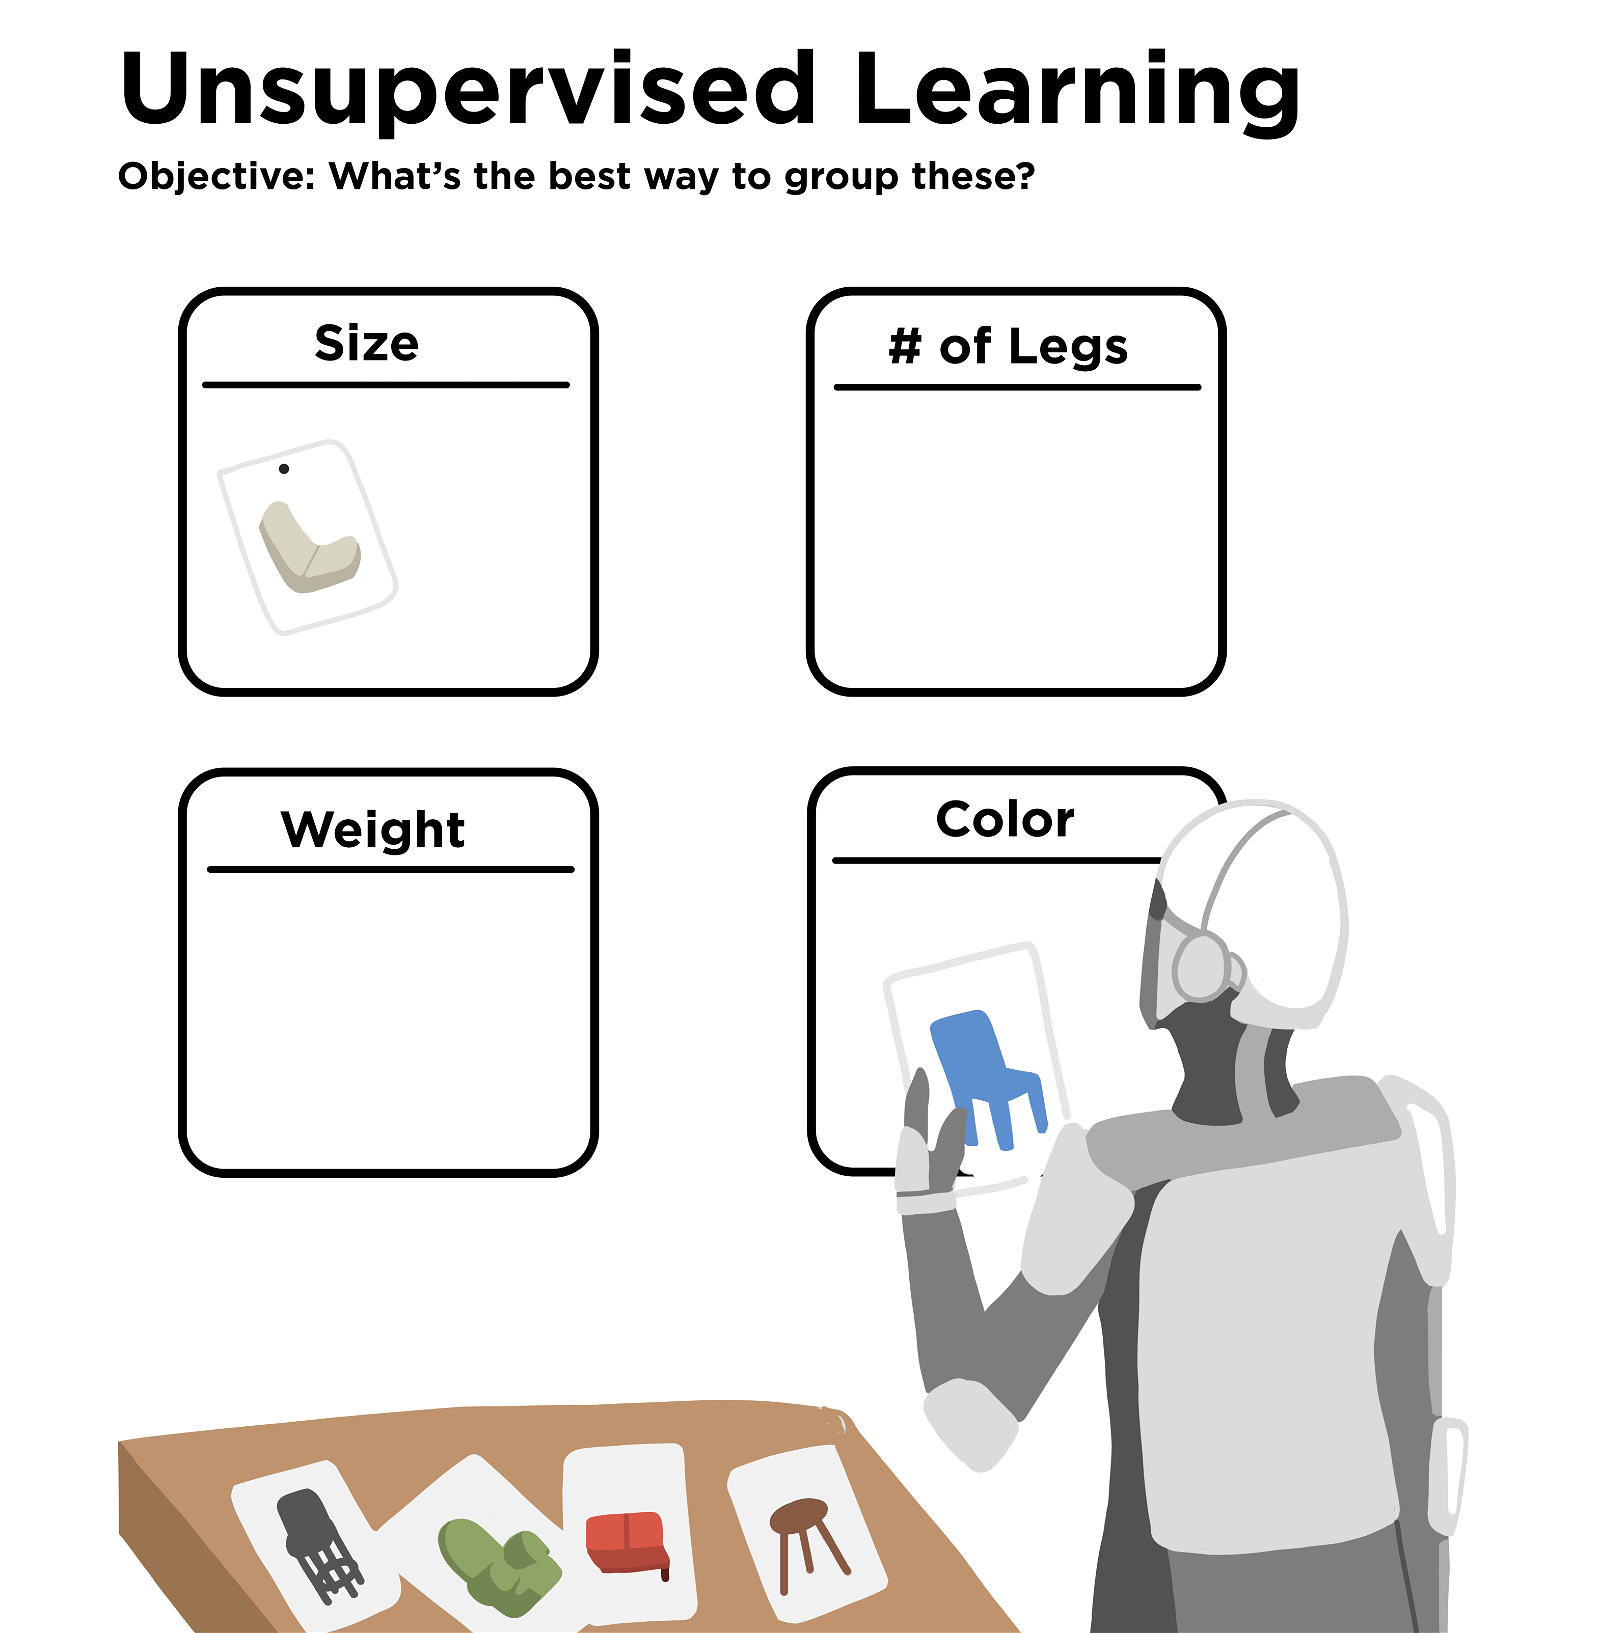
In unsupervised learning, developers don’t give any labels and let the algorithm find its own patterns. Sometimes machine learning algorithms find totally unexpected patterns and solutions. Then researchers can try to learn how the algorithm found its answer. Sometimes this leads to new experiments based on what the algorithm learned.

A title at the top states “Reinforcement Learning” with a subtitle underneath that says “Objective: Paint a hand.” A robotic figure wears a blue beret and holds an artist’s palette with white, yellow, orange, blue, brown and black paint, as well as mixed colors showing green, tan, and blue. The figure is gesturing toward a framed painting of a hand. The hand has seven digits. Only four have fingernails. A text box at the lower right says “Results: Looks like a hand” and “Doesn’t look like a hand,” with the latter marked. A thought bubble emanating from the figure’s head says “Next time, I’ll reduce the amount of fingers to 6 and see if I get it right!”

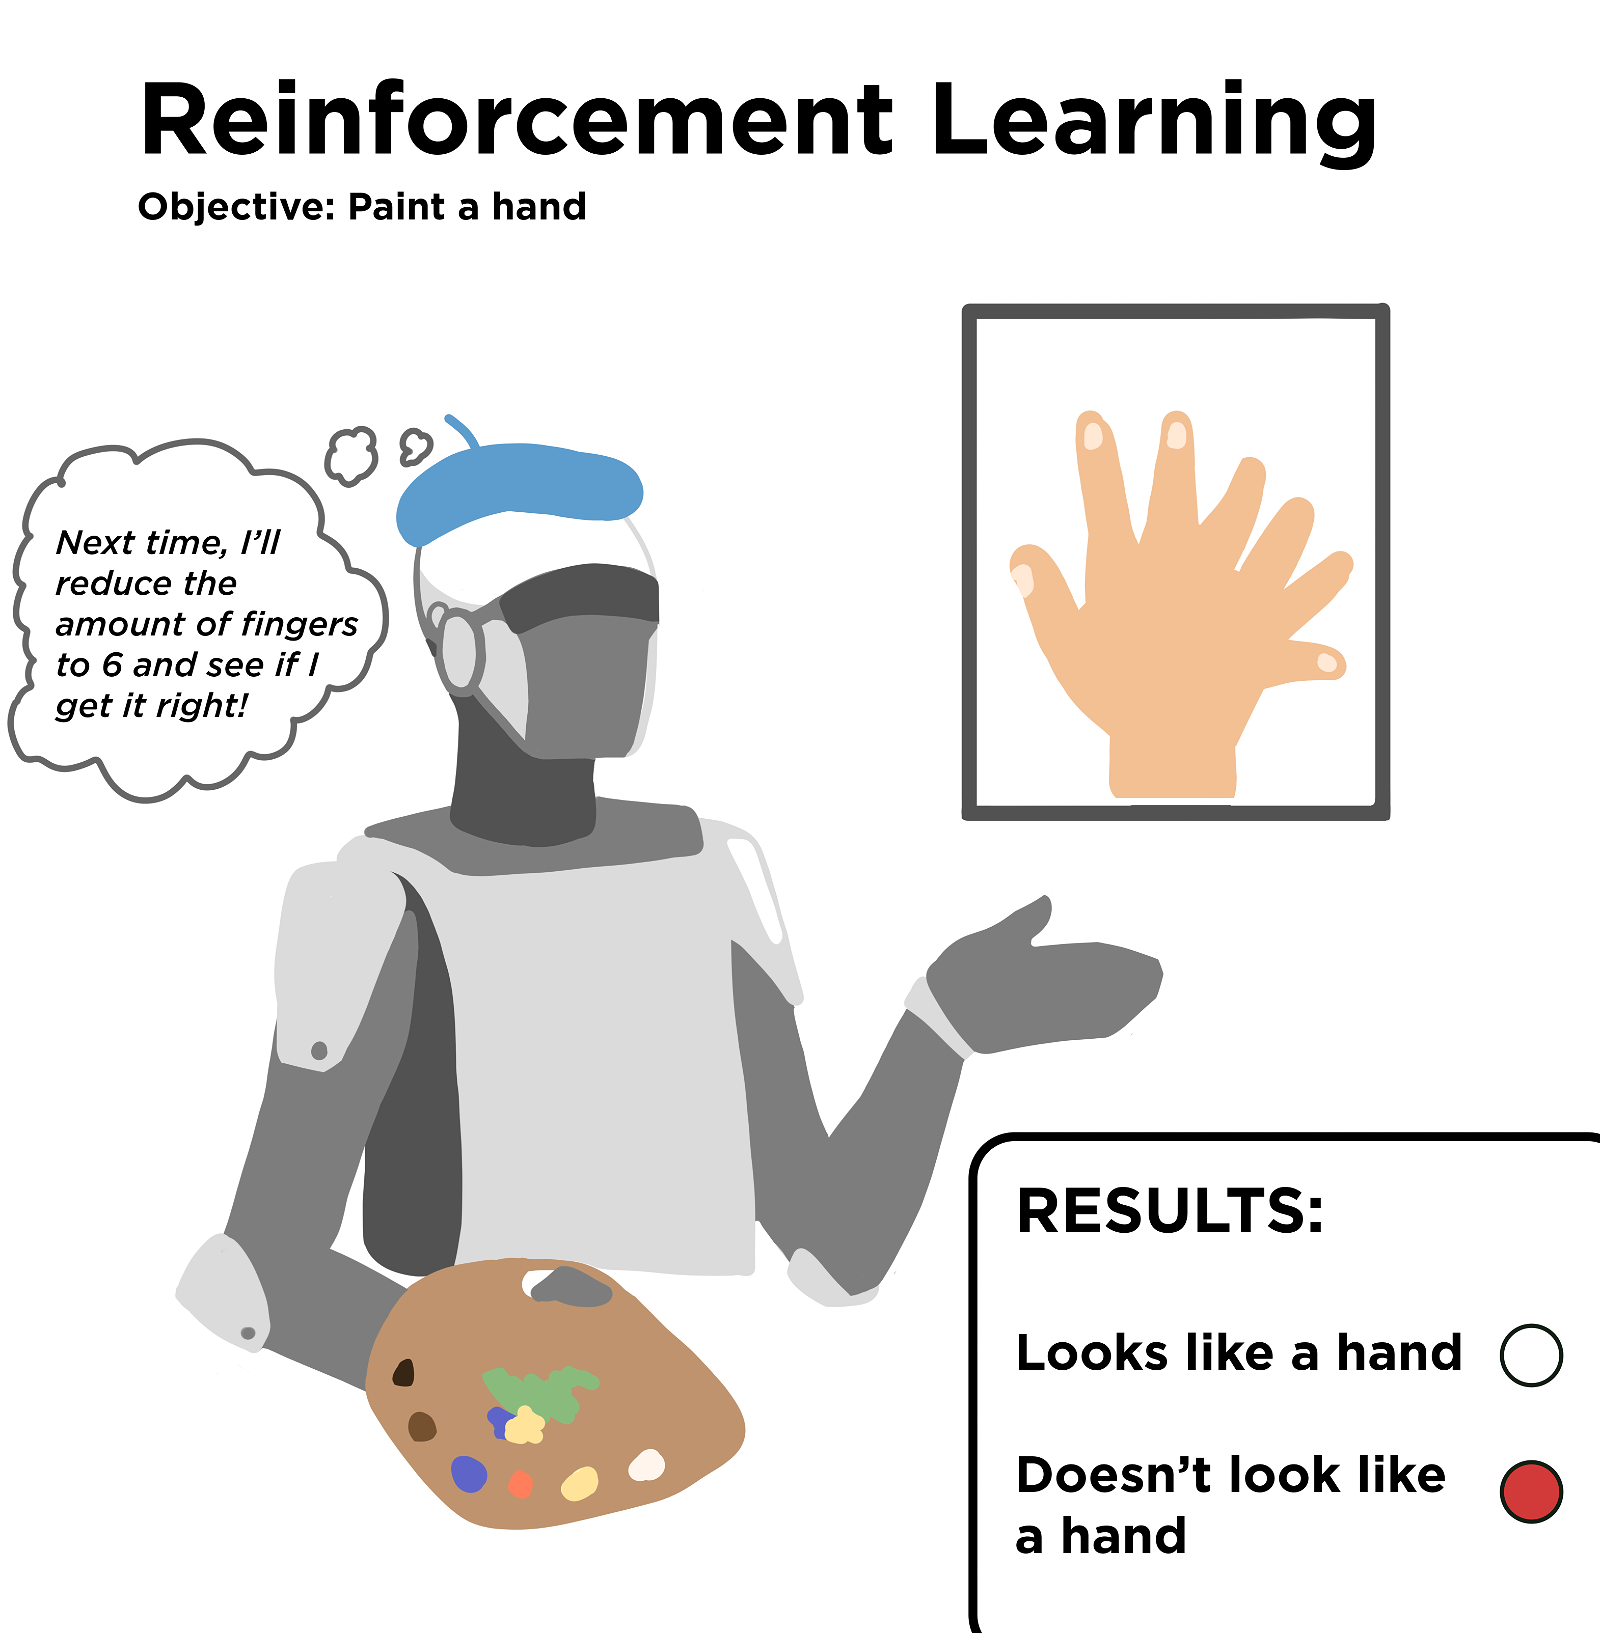
In reinforcement learning, developers give the algorithm a task. This task could be carrying on a natural-sounding conversation or winning a game of chess. As the algorithm tries different approaches, it gets feedback on how well it did. Then it tries another approach to see if it can do better the next time.

How big is big data?

When we talk about big data, we need to use big numbers. Here’s a quick guide:

One byte is about enough data to encode one word. A megabyte is one million bytes. A gigabyte is 1,000 megabytes, or one billion bytes. And the numbers go up from there, in multiples of 1,000: terabytes, petabytes, exabytes and zettabytes.

Let’s put that in some context. Digital photos take up a few megabytes. A high-definition movie takes up a few gigabytes. A high-end smartphone can hold a terabyte. The Library of Congress' digital collections encompass a few dozen petabytes.

But the amount of data created every day on the internet is a thousand times more than that. It’s on the scale of hundreds of exabytes.

What’s the point of all these numbers? It’s to show that big data can get really big - and the amount of information we’re generating every day will only keep growing. Some estimates show that we’ll be generating 181 zettabytes a year, or 181 trillion gigabytes, by 2025.

There’s not really a defined minimum amount of data to qualify as big data. Whether it’s the raw data from weather sensors or the internet behavior of millions of users on a social media site, if it takes specialized computer systems to process and store it, it's big data.

Take the human genome, for instance. It’s more than three billion letters long - enough to fill 130 printed books. It might be possible for a person to read all that information. But to sort it, analyze it, and compare it against hundreds of thousands of other genomes to find significant and meaningful patterns? That’s going to take some serious computer power and machine learning software. That makes the study of genomes, called genomics, an application of big data.

Four squares of different colors are in a line. Each square is made of 1000 small squares. At the center of each large square, some small squares are a different color. The leftmost large square is purple, with the title “1 Terabyte = 1000 Gigabytes.” At the center of that square are 145 light blue small squares, with the legend “Amount of data to stream all Marvel movies in HD = 145 GB.” The next square is red, with the title “1 Petabyte = 1000 Terabytes.” At the center of that square are 18 purple small squares, with the legend “Amount of data generated by the James Webb Space Telescope every year = 18 TB.” The next square is orange, with the title “1 Exabyte = 1000 Petabytes.” At the center of that square are 21 red small squares, with the legend “Digital collections of the Library of Congress = 21 PB.” The rightmost square is green, with the title “1 Zettabyte = 1000 Exabytes.” At the center of that square are 328 orange small squares, with the legend “Amount of data generated every day = 328 EB.”

Data is measured in multiples of 1,000. So one zettabyte is one trillion gigabytes. That’s a lot of selfies!

Finding your place in big data

Big data and personalized medicine are going to be a part of our future. Big data is, well, big, but it’s also built from individual experiences and events. Studying big data helps develop customized solutions to benefit individual people.

Communities

You are a part of many communities throughout your life. Communities offer guidance, understanding and companionship.

Each community faces challenges, and science can often help find solutions. Big datasets can include more communities. With enough data from a community, we can see what's the same and what's different among its members. This helps researchers focus on a community’s specific needs and challenges. Focused, customized solutions can help a community thrive.

People like you

You also face challenges that are unique to you. They’re connected to your genetics, ancestry, health history, environment, and lifestyle. You are unique. Bigger and bigger datasets, however, have a better chance of including people like you.

Why is this important? Because our bodies' reactions to food, exercise, medications, and diseases are different. If scientists can understand what those differences are, then each person can get medicines, recommendations, and treatments that work best for them, instead of one-size-fits-all health care.

In context

Big data can help us put our individual experiences into a larger context. It can also help make sense of situations where many factors may affect the outcome. Imagine that several members of your family have diabetes. You might wonder about your own risk of being diagnosed with diabetes, and what you can do to reduce that risk. Big datasets can include lots of other families, both with and without diabetes. Big data can help you understand how much of your risk you can control (your lifestyle behaviors) and how much you can’t (your genetics, physiology, or exposure to air pollution).

An illustration of a woman with a blue shirt and grey pants standing in the center of the image. Her hand is up as if waving. The illustration of the woman, as well as all other illustrations of people, does not include facial features.

Around the woman are five segments. Beginning at the top right and proceeding clockwise, the segments show a man holding the flag of Greece; two girls playing soccer together wearing different uniform colors; a stethoscope, a red cross, and a page with medical records; a team of five people rowing a red boat in an urban river; and a woman seated in a chair leading a discussion or class with three other women.

Some of your communities depend on where you live, like your neighborhood or city. Some depend on biology, like your ancestry or traits. Some depend on your health, such as communities that support people with certain conditions. Others come as you seek out people with similar interests or life experiences.

Examples of big data in biomedicine

Big data can help us look at biomedical problems in a new way. Sepsis, or the body’s overreaction to an infection, is one very serious problem in medicine. It’s estimated to cause up to half of deaths in U.S. hospitals every year. But it’s tricky to catch and treat in time.

A study applied big data to identify sepsis early. The study combined data on disease-causing organisms in blood samples and patterns of gene activity in people with sepsis.

Around 300 people participated in the study. They contributed blood samples while they were in the hospital. Researchers looked for DNA from bacteria, fungi, or viruses that might be present in blood samples. This helped identify the microorganisms that could be making people sick. Disease-causing microorganisms are also called pathogens.

The researchers also looked at which genes were active in a person. Nearly all of a person’s cells have the same genes, but genes are turned on or turned off depending on the cell type. They can also turn on or off in response to a stimulus. If the genes for a person’s immune system are very active, that might mean sepsis.

The researchers looked at the activity of more than 5,000 genes. They then used machine learning to figure out what kinds of gene activity were associated with sepsis. Those results combined with the pathogen data in an algorithm to predict whether or not a person likely had sepsis, based on blood sample data.

The algorithm worked very well. It correctly identified 99% of samples that had already been diagnosed with bacterial sepsis. It also identified sepsis in 74% of suspected cases. Someday this algorithm could help doctors quickly get people with sepsis the help they need.

Big data can show us how health is related to more than just blood samples and bacteria. A study looked for things in common among people readmitted to the hospital after having sepsis. The study used data from the All of Us Research Project. The researchers found that social factors affected people's likelihood of going back to the hospital. Social factors include a person's income, education, and access to transportation.

Learn more about what this study found, and about how this knowledge helps doctors, here

A gene expression heat map diagram. The diagram is roughly square. Two headings at the top denote “No-sepsis” on the left and “SepsisBSI+sepsisnon-BSI” on the right. Down the right vertical axis of the graph, each row is labeled with a different gene name. Down the left vertical axis, lines denote relationships between genes. Each column denotes a different participant sample. Samples in the “No-sepsis” left section are generally in blue colors, except for the bottom row, labeled as the PITHD1 gene, which is in red and pink colors. Samples in the “Sepsis” right section are generally in red and pink colors, except for a few columns that are in blue colors and the PITHD1 row, also in mostly blue colors.

Each row of rectangles represents a different gene and each column represents a different sample. The color tells us whether the gene is more active (red) or less active (blue) than usual. Can you see the pattern here? A machine learning algorithm can, which can quickly give health care providers insights into when there may be a ‘hidden’ problem and a nudge that extra precautions may need taken.

References

References

Beulens, J. W. J., Pinho, M. G. M., Abreu, T. C., Braver, N. R. den, Lam, T. M., Huss, A., Vlaanderen, J., Sonnenschein, T., Siddiqui, N. Z., Yuan, Z., Kerckhoffs, J., Zhernakova, A., Gois, M. F. B., & Vermeulen, R. C. H. (2022). Environmental risk factors of type 2 diabetes—an exposome approach. Diabetologia, 65(2), 263–274. https://doi.org/10.1007/s00125-021-05618-w

Cohen, M., Puntonet, J., Sanchez, J., Kierszbaum, E., Crema, M., Soyer, P., & Dion, E. (2023). Artificial intelligence vs. radiologist: accuracy of wrist fracture detection on radiographs. European Radiology, 33(6), 3974–3983. https://doi.org/10.1007/s00330-022-09349-3

Delua, J. (2021). Supervised vs. Unsupervised Learning: What’s the Difference? IBM. https://www.ibm.com/blog/supervised-vs-unsupervised-learning/

Duarte, F. (2023). Amount of Data Created Daily. Exploding Topics. https://explodingtopics.com/blog/data-generated-per-day

Garnier, E. (2012). Leicester scientists print human genome in 130 books. BBC News. https://www.bbc.com/news/av/uk-england-leicestershire-20520843

Kalantar, K. L., Neyton, L., Abdelghany, M., Mick, E., Jauregui, A., Caldera, S., Serpa, P. H., Ghale, R., Albright, J., Sarma, A., Tsitsiklis, A., Leligdowicz, A., Christenson, S. A., Liu, K., Kangelaris, K. N., Hendrickson, C., Sinha, P., Gomez, A., Neff, N., … Langelier, C. R. (2022). Integrated host-microbe plasma metagenomics for sepsis diagnosis in a prospective cohort of critically ill adults. Nature Microbiology, 7(11), 1805–1816. https://doi.org/10.1038/s41564-022-01237-2

Krenn, M., Pollice, R., Guo, S. Y., Aldeghi, M., Cervera-Lierta, A., Friederich, P., Gomes, G. dos P., Häse, F., Jinich, A., Nigam, A., Yao, Z., & Aspuru-Guzik, A. (2022). On scientific understanding with artificial intelligence. Nature Reviews Physics, 4(12), 761–769. https://doi.org/10.1038/s42254-022-00518-3

Mummert, T., Subramanian, D., Vu, L., & Pham, N. (2022). What is reinforcement learning? IBM Developer. https://developer.ibm.com/learningpaths/get-started-automated-ai-for-decision-making-api/what-is-automated-ai-for-decision-making/

Prisco, J. (2017). Why UPS trucks (almost) never turn left. CNN. https://www.cnn.com/2017/02/16/world/ups-trucks-no-left-turns/

Rouse, L. (2023). Marvel Movies: What Is the Runtime of the Entire MCU? Lifehacker Australia. https://www.lifehacker.com.au/2023/08/marvel-movies-tv-series-runtime/

Big data Definition & Meaning - Merriam-Webster. (n.d.). Merriam-Webster Dictionary. Retrieved August 8, 2023, from https://www.merriam-webster.com/dictionary/big%20data

Frequently Asked Questions. (n.d.). Library of Congress. Retrieved August 8, 2023, from https://www.loc.gov/programs/digital-collections-management/about-this-program/frequently-asked-questions/

How Much Data Does Disney+ Use? - Disney Plus Informer. (2023). Disney Plus Informer. https://www.disneyplusinformer.com/how-much-data-does-disney-use/

Orders of magnitude (data). (n.d.). Wikipedia. Retrieved August 8, 2023, from https://en.wikipedia.org/wiki/Orders_of_magnitude_(data)


APA format:

Genetic Science Learning Center. (2023, October 18) What is Big Data?. Retrieved May 14, 2024, from https://learn.genetics.utah.edu/content/allofus/bigdata

CSE format:

What is Big Data? [Internet]. Salt Lake City (UT): Genetic Science Learning Center; 2023 [cited 2024 May 14] Available from https://learn.genetics.utah.edu/content/allofus/bigdata

Chicago format:

Genetic Science Learning Center. "What is Big Data?." Learn.Genetics. October 18, 2023. Accessed May 14, 2024. https://learn.genetics.utah.edu/content/allofus/bigdata.